Note: This article has now been updated for 2018, here: UK Social Media Statistics for 2018
UK Social Media Statistics for 2017
The tree is down and the tinsel is wilting, so it must be time for our annual review of social media use in the UK at the start of 2017. We do this for two reasons: one, because statistics that focus purely on UK based users can be hard to come by, and two, because it also helps us clarify our own “hunches” about how things are going for each of the major sites, and use that information when we’re working with our business and third sector clients in the UK.
There’s also some good news: UK specific statistics have become a little easier to find this year. Props must go to agency We Are Flint for carrying out their own primary research during 2016, complete with actual transparency about how the research was carried out (link below to the entire report) and Statista.com is also offering a decent amount of open source information. We’re grateful to both organisations for those contributions, as well as the other source sites linked within this post.
UK social media in 2017: general thoughts
We talked in our last annual update about the fact that the mainstream social media market is now mature. Nothing has changed there; there haven’t been any significant upsets this year, and it’s been a while since a genuinely “new” entrant offered anything different. The “Big 3″ in the UK (Facebook, Twitter, LinkedIn) have more or less stayed static in user terms for several years. Apart from a potentially interesting Twitter vs Instagram clash, the only action is around the smaller players and ancilliary apps like Snapchat which we see more as utilities than social networks.
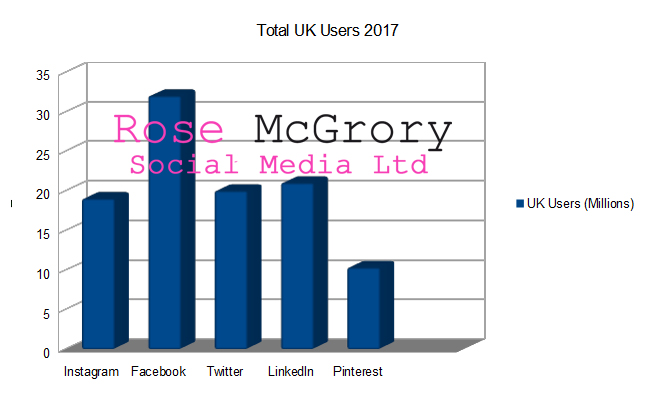
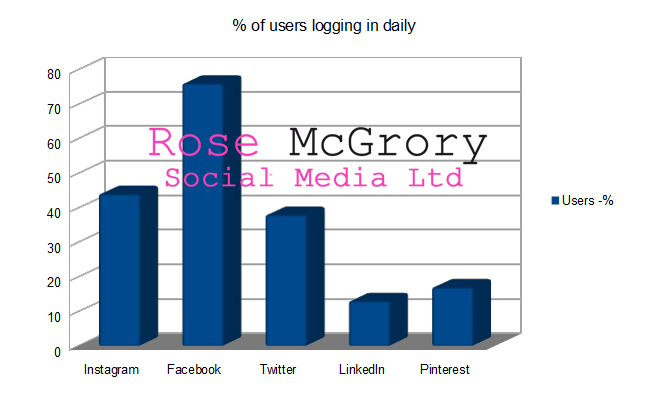
We’re going to kick off this year with two charts that we think contain the most crucial information for social media strategy planning if you’re a UK business: Total UK Users by Site (based on the current “best estimate” as described below, where the site has not provided figures), and the percentage of those users who log in daily.
Remember, a registered user who never goes onto the site isn’t going to be a viable target for your marketing!
UK Facebook Users 2017
So let’s kick off our indepth review with the Big Daddy, Facebook. Once again the overall number hasn’t budged all that much; we’re looking at around 32 million user accounts in the UK. That’s been pretty steady for around three years now. We Are Flint’s report puts the proportion of over 18s in the UK who use Facebook at 78% – so still, after all these years, probably the single most consolidated channel available to marketers for accessing most of the population in one place (after snail mail, which surely only those printing their own money can afford these days!).
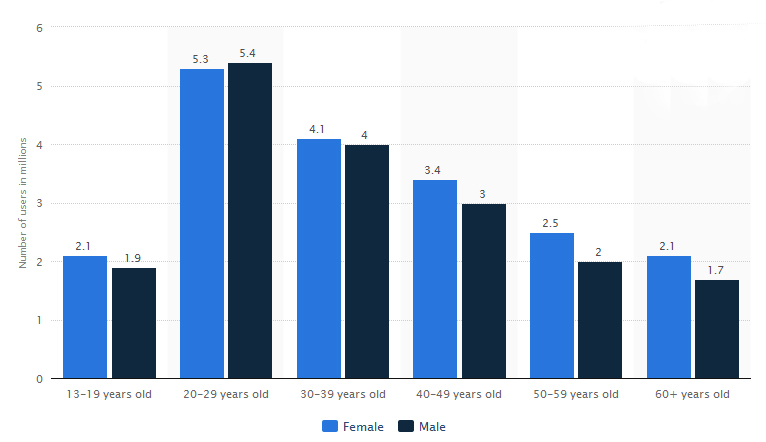
We also have, courtesy of Statista.com. a nice breakdown of the demographics within that figure, which does offer some interesting observations. No, Facebook probably isn’t “cool” any more. My ageing Samsung Galaxy, if it was ever cool, certainly isn’t now either, but that doesn’t stop me using it constantly.
Looking at these stats, the same is true of Facebook: the largest demographic is the 20-29 year olds, clearly showing that it’s not just everyone’s Mum using Facebook these days.
With organic post reach now sitting at around a measly 10%, the major area of interest for businesses using Facebook now is the development of new types of advertising, and the fluctuation in cost. This year we’ve seen enhancements or new introductions in ever more sophisticated ad targeting – Lookalike Audiences, Dynamic Ads and a whole suite of options around remarketing to website visitors. For large ecommerce sites this is a godsend. For smaller businesses, anecdotally it seems as though the cost of reaching the standard 1,000 eyeballs, or achieving a good volume of link clicks, is on the increase. This may be partly due to the more targeted types of advertising being more costly, which is not unreasonable if the results match up to their promise.
There are numerous studies showing that social media advertising is by far the cheapest medium. Ad Espresso tell us that overall CPM on Facebook actually declined during 2016, but there are so many factors influencing what any individual business will spend that it’s almost inevitable that your mileage will vary. As an aside, if you’re interested in what factors affect your ad spend, and how they affect it, Ad Espresso have a superb report here covering every aspect, from ad placement to the demographic being targeted, and the day and even hour that the advert runs in.
UK LinkedIn users 2017
Like all the mature sites, LinkedIn’s growth is also slowing, but there is still some growth. Last year we had a figure of around 19 million UK users; this year the figure is 21 million. You can see LinkedIn’s own global figures here.
When planning your strategy, though, it’s important to remember that the average user uses LinkedIn very different to the way Facebook’s average user uses Facebook. And that’s why you won’t see too much emphasis on metrics such as “monthly active users” or time spent on the site in an average month. Unless they are actively job hunting, or actively using LinkedIn as part of their job role (think Enterprise software sales execs), we believe that most people who are registered with LinkedIn, don’t necessarily touch that account for weeks at a time.
Again we’re going on anecdotal evidence with a pinch of common sense – by its very nature, LinkedIn’s content offering doesn’t begin to compare with how compelling Facebook’s is, where users are on the site multiple times each day exchanging banter with their social networks or just surfing for something to cheer themselves up.
UK Instagram Users 2017
Instagram themselves haven’t released any new data since that which we used in last year’s report, giving us 14 million Monthly Active Users in the UK, from a global MAU figure of 300 million. The global figure was updated in December 2016 to an impressive 600 million, but it would basically be a total guess as to whether the UK’s growth has kept pace with the global growth.
It’s hard to tell at this point whether Instagram is continuing to cannibalise Twitter’s market, particularly among the younger demographic – that seemed to be the case in previous years, but the research that we’re referencing here doesn’t really support it. Which is good from a marketing point of view, because the lack of native “retweet” function and inability to include links in a post, means that driving anything other than general brand awareness is harder work on Instagram!
The We Are Flint survey suggested that 29% of UK adults use Instagram, which would give us a figure around the 19 million mark. The same report also gives a proportion of 64% of users as being under 30 – but gives the same figure for Twitter, which has generally been considered to be an older demographic thus far. Even more interestingly, Instagram has something of a peak in the higher income brackets (though not as much as Twitter does); 46% of users reported a household income of over £48k per annum.
From a general strategy point of view, Instagram has joined Facebook and Twitter this year in filtering which of your followed accounts’ posts you actually see. That seems a clear pointer that in the not too distant future, you can expect to be paying Instagram for any kind of guaranteed reach at all, in the same way we now have to pay for reach on Facebook.
UK Pinterest Users 2017
We’ve not had anything directly from Pinterest this year on the subject of UK user numbers, so the stats below come from third party research.
All the indications though are that Pinterest’s early period of stellar growth has definitely stalled. Although Pinterest did tell us that their global MAU figure was up to 150 million in October of 2016, just 5% of the UK population log in to Pinterest on a daily basis.
Interestingly, at some point the Pinterest user demographic has got a LOT younger. In the US, and in the early days of UK use, older (as well as more affluent) users were in the majority. In 2017 however, research from both Statista and We Are Flint suggests that 50%+ of Pinterest users are in the 18-29 age bracket.
The female gender bias has persisted however, with 38% of women who are online reporting that they use Pinterest, whereas only 20% of men say the same thing.
In terms of how people are actually using the site (which should give you some clues as to whether your business will be commercially successful there), here’s a useful summary from Pinterest’s CEO, Ben Silbermann :
Pinterest is more of a personal tool than a social one. People don’t come to see what their friends are doing. (There are lots of other great places out there for that!) Instead, they come to Pinterest to find ideas to try, figure out which ones they love, and learn a little bit about themselves in the process.
UK Twitter Users 2017
Twitter did provide a very minimal status update around the middle of last year, which gave a global MAU figure of 313 million, and 79% of those accounts being outside the US. That would be sufficient to keep them ahead of Instagram in the global rankings, just.
Other independent research gives us figures of 45% of UK Online Adults using Twitter, with 37% of those account holders logging in daily. Using the ONS figure of 45.9 million for the UK’s online population, that would give us a user base of around 20 million. That seems plausible, if maybe a little generous, compared to the last “official” UK figure of 13 million which was provided in 2013.
The same research reports a surprisingly young demographic, too: 64% of users are 18-29, 57% 30-49, and 33% 50-61. The more affluent citizens are also over-represented on Twitter, with 62% in the 48K+ household income bracket – bearing in mind that the median UK household income this year was just over £26k.
If you’re interested in how people are actually using Twitter, there’s a really good, and up to date, report here from the BBC. From that we learn that a relatively small number of highly active users dominate in terms of posting content – 1% of accounts are responsible for 20% of all tweets, and 85% of all tweets are accounted for by just 15% of total accounts.
The number of actual tweets sent each day has remained almost constant since 2013, despite increases in monthly active users. So, if you’re planning a campaign on Twitter, be aware that there are a *lot* of users out there who read but never post!
So there we have it: the social media landscape for the UK in 2017. As ever, we hope it’ll help you plan your strategy – and if you need some help figuring out what you should be using and how, get in touch!
Credits
https://weareflint.co.uk/uk-social-media-demographics-2016
www.statista.com
www.social-media-co.uk


Leave A Comment