NOTE – This post has been updated for 2017, find it here: UK Social Media Statistics for 2017
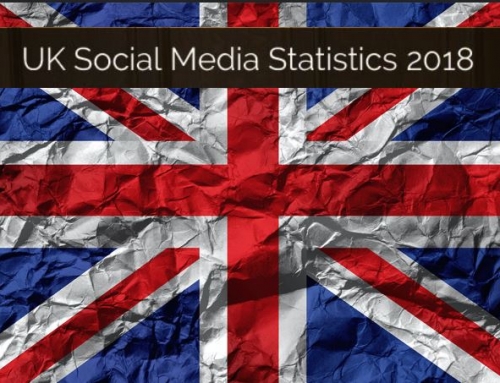
It’s that time again! Welcome to our fifth (yikes!) annual roundup of all the stats we can find for you, on specifically UK-based use of social media as we go into 2016. As we work mainly with UK businesses and third sector organisations, the commentary here will once again be mainly focusing on the implications for them.
We’ve also thrown in a few other interesting titbits regarding trends in social media use in the United Kingdom, and our own thoughts about where things are heading.
UK Social Media in 2016
We opened last year’s stats post by talking about how social media is now mainstream amongst UK businesses; what we see now is that the majority of businesses are engaging with social media in some form, and consider it to be a long term part of their marketing mix. Having said that, in certain sectors there’s a huge lack of proper integration of social media to the business as a whole, and limited value on offer to the consumer.
From a consumer point of view, there’s increasing discrimination about the rewards of engaging with businesses on social media. The novelty factor has long since worn off, and in many ways it’s harder than ever to satisfy increasingly savvy audiences.
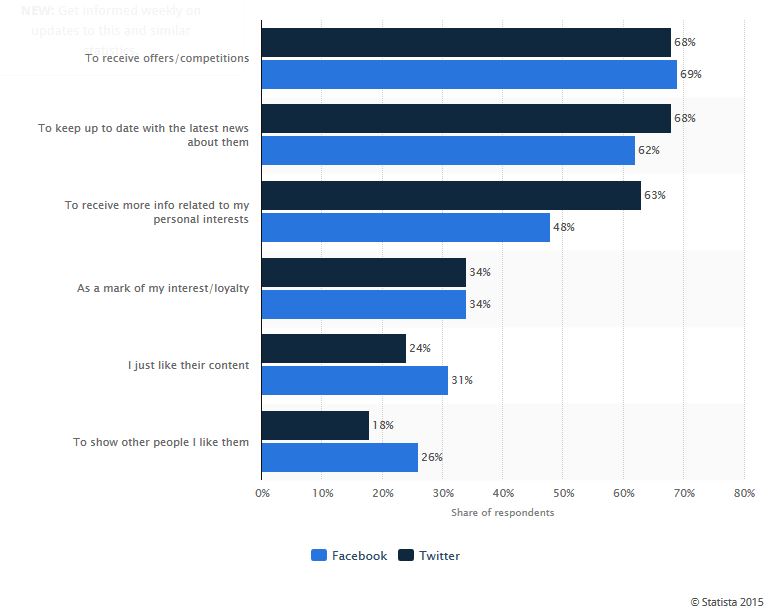
Before we go any further, here’s a very informative chart from some recent research by Statista, showing the reasons why consumers follow businesses on Facebook or Twitter. It’d be very interesting to have answers to the same question for LinkedIn and Instagram, but business marketers should note that the proportion stating “I just like their content” is pretty small; on the whole, the “what’s in it for me” topics (giveaways, news updates, a strong personal interest in the product or service) dominate.
Leading reasons for interacting with companies on social media platforms in the United Kingdom (UK) in 2015, by network:
So, below is what we know in detail about the statistics for individual sites. Wwe’ve included a Monthly Active Users (MAU) figure in some places; where it’s available, this is a more helpful figure than the “Users / Accounts” statistic, particularly for sites which are in a mature phase of development, ie largely at saturation point in terms of user accounts, but with changes in activity levels within that account base.
MAU does exactly what it says on the tin; shows you how many people actually logged in and were active on the site, rather than how many people have accounts. Consider how unlikely people are to actually delete their Facebook account, despite (for example) having moved most of their social media activity to Instagram, and you can see the importance of the MAU figure over the Accounts number.
UK Facebook statistics 2016
On the whole, there’s very little to see here. We’ve seen nothing to suggest that user numbers aren’t remaining steady at around the 30 million mark; sites which give higher figures are generally basing them on projections against past growth.
So, there’s not much happening in terms of increasing the UK user base. This is where MAU figures, ideally broken down by demographic bands, would really tell us the whole story. Because the population shifts all the time…so if there’s very little increase in the overall user figure, something must be happening within that. Younger people aren’t bothering to register? Or they are, but sufficient others are leaving the site to cover up the number. We just don’t really know.
In November, we were given a MAU figure for Facebook of 1.5 billion globally – but again, ongoing huge increases in use in places like India could potentially be covering a drop in usage in the more established markets (US and UK).
However, as we said last year, Facebook’s status as by far the #1 social media platform globally remains unchallenged, and B2C businesses ignore it at their peril.
From a marketer’s perspective, Facebook’s monetisation strategy is now fully established. Or to put it another way, the average business has to commit to paid promotion in order to exploit Facebook as a marketing channel, as organic post views continue to fall. That also makes it more important than ever that your organisation’s audience recruitment strategy is carefully thought out and only attracts genuine potential customers – otherwise you’ll be paying to market to those non-prospects for as long as they (and you) are on Facebook.
Facebook’s advertising offering continues to get more and more sophisticated, with the recent introduction of video and carousel ads to the UK, along with excellent tracking facilities, provided your website is set up to allow you to take advantage of them. Taken together, the reduction in organic reach and increasing paid for options predict an increasing emphasis on smart use of advertising rather than winning timeline space by providing amazing content – although quality content is still just as important for creating long term consumer relationships.
UK Instagram Statistics 2016
In celebration of Instagram providing us with UK specific user stats for the first time ever, we’ve promoted them to the second site on our rundown!
In July, they announced a figure of 14 million Monthly Active users for the UK. To try and give that some context, we are also being told that the global MAU figure is 300 million, vs Facebook’s 1.5 billion. So still not a challenger for the top spot, but definitely a challenger to Twitter – of which, more below.
There’s one research study reported which gives some limited demographic breakdown on UK Instagram users, although we’re put off by the “Instagram has overtaken Facebook as the most used network” headline (it hasn’t; the data doesn’t support that, just a 7% drop in Facebook’s use vs a 14% increase in Instagram’s. If they started from the same number then that would be correct, but they REALLY don’t – see the MAU figures above for the size of the gap!). Anyway assuming the rest of the data has been accurately reported, we learn the following:
- Instagram has a much younger audience, 39% of its UK users are aged 16-24.
- Facebook’s 16-24 demographic are just 16% of UK users.
- 64% of Instagram users are female vs 56% of Facebook users.
There’s also evidence that Instagram will benefit commercially from being able to piggyback on the sophisticated advertising solutions already being run by its parent company Facebook, which will generate additional resources to improve the offering and continue to drive growth.
UK Twitter statistics 2016
Once again, Twitter are suspiciously quiet on user numbers. The last official UK figure we had from them was at the end of 2013 – 15 million.
A research study conducted by We Are Social in the UK in early 2015 gives us the table below. This suggests a figure of 12.4 million based on a 19% proportion of the UK’s 65million population – assuming that the sample interviewed were representative.
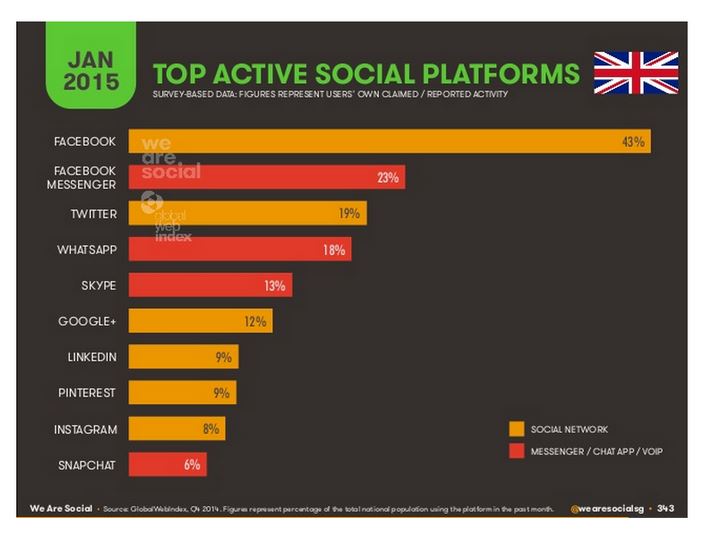
Aside: Two other interesting things about the above chart: the Instagram figure would equate to 5.2 million, vs the 14-odd million given by Instagram just 6 months later. And secondly, how far ahead Facebook Messenger still is above Snapchat, despite a lot of talk about the latter!
Anyway, assuming we believe that data, then Twitter appears to be the latest victim of static (or slightly declining) user numbers in the UK. It seems plausible that Twitter is the most likely victim of Instagram’s success; the way Twitter is typically used (relatively anonymous, networks developed by interest rather than “real world” links, etc) is closer to Instagram than Instagram is to Facebook, and Instagram’s user interface and glossy filters is perhaps more seductive than Twitter – especially to a younger audience.
From a marketing perspective, Instagram remains more challenging than Twitter for many businesses. Not all are lucky enough to be working in a sector that provides lots of attractive visuals, and the lack of a curation feature (essentially, you can’t easily “re tweet”) on Instagram removes an avenue for content which is often successful on Twitter.
Plus, as of right now, the lack of support for multiple Instagram accounts within the app remains a pain in the backside! Despite all of that, the Twitter / Instagram battle is going to be worth keeping an eye on this year.
UK Pinterest Statistics 2016
2015 was the year that Pinterest appointed a UK specific country manager, and while being a little coy about the exact numbers, it claims to have doubled its UK user base in 2015.
A ComScore report quoted here suggests a Monthly Active User figure of around 10.4 million, which again is more than enough to establish Pinterest as part of the UK Major League of social media sites!
A couple of other useful titbits from Pinterest’s co founder regarding the UK Pinterest audience:
DIY and Recipes are the top topics for UK Pinterest users, with 52% and 46% having searched for those subjects respectively.
We’re told that the top reasons for users curating their own boards are 37% planning home decorations, 17% a holiday and 14% a wedding.
In a strong contender for Most “errrr, whaat?!” Facts of 2015, Pinterest recently published a blog article in which they state that the top searches in the UK are “… Pork pie, Broken-glass nails, Alternative Christmas trees, Dr Who crafts, Toad in the hole, James Bond, Meat-free Mondays, Alexa Chung haircut, Men’s undercuts and Lancashire hotpot.”. Right, then.
Where’s Pinterest headed this year? Well, they continue to stress the strong links between Pinterest and user engagement – for example here, 70% of users going on to act in some way on the content they find. Buyable Pins are a recent arrival in the US, and we’d expect to see them arriving for UK users this year, continuing Pinterest’s move towards uber-online-shopping-directory.
UK LinkedIn statistics 2016
Once again, LinkedIn are our shining stars for ongoing transparency, user wise! LinkedIn’s own permanent, and regularly updated, press page includes a current figure of 19 million UK users, showing steady growth from last year’s 15 million. And two years previously the number was 10 million, so the growth is only accelerating. Ah, the joys of companies who provide standard, trackable, easy to find stats!
The clear and ongoing growth is reflected by the demand we’re seeing for LinkedIn training, too. More and more organisations are recognising the need to have (at least!) a constructive, useful presence on LinkedIn for the company and its key staff, and many are exploiting it well for lead generation and / or a core communications platform to staff, customers and prospects.
We still think that LinkedIn has a very, very long way to go to match the “stickiness” of other social media sites; in an unrepresentative survey, 100% of our LinkedIn trainees in 2015 answered “er, NO” to the question “do you ever wake up in the morning and think “ooh, I must check LinkedIn!””. In that respect, LinkedIn is almost not a social media site at all; the impulses that drive users to be there are more about career hygiene factors and basic usefulness (essentially, being the biggest online directory of other professionals ever, for free…) than about interest or enjoyment. And maybe that will continue to be enough, but it would be interesting to see a genuine “social” side take off!
So that’s it: the state of play for social media in the UK as we enter 2016. We hope it’ll be helpful to you in planning your strategy for this year.
Disclaimer: we’re neither academics nor statisticians, and although we do our best for accuracy we’re reliant on publicly available sources. So while we admire the chutzpah of more than one student who called us up in 2015 requesting evidence of our academic qualifications “So that I can quote your article in my thesis“, all we can say to these people is – do your own research, mate. You have more time on your hands than we do 😉
Leave A Comment